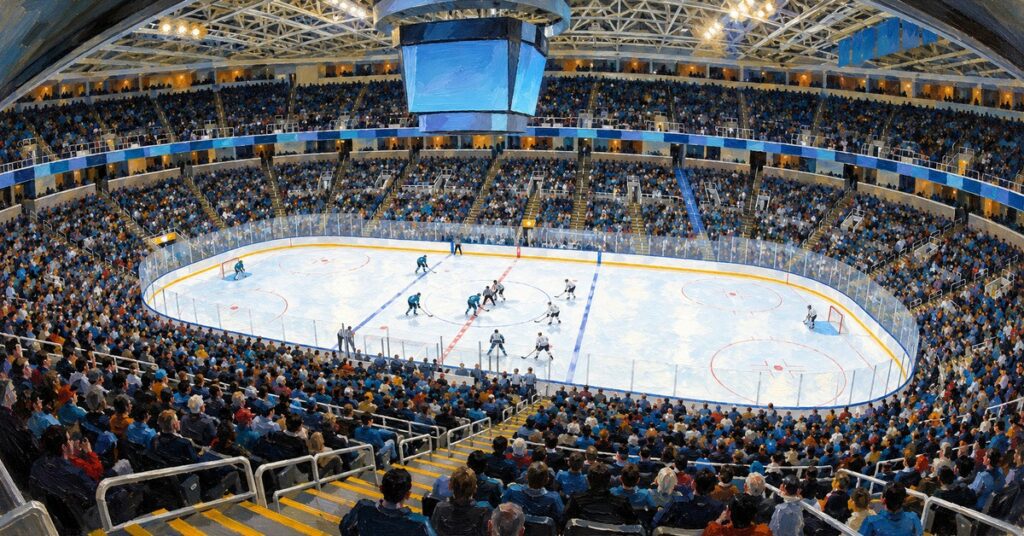
NHL matchup
10/27/202610:30 PMSAP Center at San JoseSan Jose, CA

Sabres5 – 4 – 3vsSharks6 – 6 – 1

Sharp side
🏠 Sharks +124
Model value
Sharp total
↑ Over 6.5
Model value
Model trendBuffalo Sabres games: +1.12 units on model total bets this season

Model total bets in games featuring Buffalo Sabres went 7–5 (58.3%) this season, for an estimated profit of 1.12 units when staking one unit per bet.

Model forecast

Projected outcome

Projected outcome: model scores and win probabilities
Team
Buffalo Sabres3.956.5%
San Jose Sharks3.543.5%
Matchup intelligence

Team grades

TeamSkatersGoalieOverall
Buffalo SabresBCB-
San Jose SharksCDD+
More for this matchup

Matchup articles

Sportsbook context

Game lines

Best price Highlighted offers compare the same selection and line across the books shown.— No usable price supplied by that book.

DraftKings
TeamMoneylinePuck Line
BUF-148-1.5 (+164)
SJ+124+1.5 (-198)
Total 6.5Over -142Under +120
BetMGM
TeamMoneylinePuck Line
BUF-145-1.5 (+155)
SJ+120+1.5 (-190)
Total 6.5Over -130Under +110
BetRivers
TeamMoneylinePuck Line
BUF-155-1.5 (+155)
SJ+130+1.5 (-195)
Total 6.5Over -139Under +112
Caesars
TeamMoneylinePuck Line
BUF-150-1.5 (+150)
SJ+125+1.5 (-185)
Total 6.5Over -150Under +115
Circa Sports
TeamMoneylinePuck Line
BUF-145-1.5 (+165)
SJ+130+1.5 (-190)
Total 6.5Over -140Under +120
FanDuel
TeamMoneylinePuck Line
BUF-150-1.5 (+142)
SJ+125+1.5 (-176)
Total 7.0Over +116Under -142
Hard Rock Bet
TeamMoneylinePuck Line
BUF-145-1.5 (+140)
SJ+125+1.5 (-185)
Total 6.5Over -145Under +115
Kalshi
TeamMoneylinePuck Line
BUF-138—
SJ+138—
Total —Over —Under —
theScore Bet
TeamMoneylinePuck Line
BUF-145-1.5 (+160)
SJ+125+1.5 (-190)
Total 6.5Over -125Under +105
Recent form

Last 10 games

Buffalo Sabres

Overall4–6–0W–L–TPuck Line6–4–0W–L–PO/U6–4–0O–U–P
DateOpponentResultPuck LineTotal
10/24/26@ WSHL 3–4W +1.5O 6.5
10/21/26vs PHIL 1–3L -1.5U 6.5
10/17/26@ MTLL 3–4W +1.5O 6.5
10/15/26@ TORW 5–4W +1.5O 6.5
10/13/26@ MTLL 3–4W +1.5O 6.5
10/12/26vs FLAW 5–3W -1.5O 5.5
10/10/26vs UTAHL 1–4L +1.5U 6.5
10/8/26vs DALL 0–4L +1.5U 6.5
10/6/26vs MINW 3–2W +1.5U 6.5
10/3/26vs CHIW 4–3L -1.5O 5.5

W win · L loss · T tie · P push · O over · U under · — unavailable.

San Jose Sharks

Overall4–6–0W–L–TPuck Line5–5–0W–L–PO/U5–5–0O–U–P
DateOpponentResultPuck LineTotal
10/24/26@ BOSL 4–6L +1.5O 6.5
10/22/26@ OTTW 6–2W +1.5O 6.5
10/20/26@ MTLW 4–3W +1.5O 6.5
10/19/26@ TORL 1–3L +1.5U 6.5
10/17/26@ DETL 3–4W +1.5O 6.5
10/15/26@ NSHW 3–2W +1.5U 6.5
10/13/26vs BOSL 3–6L +1.5O 6.5
10/10/26vs EDML 1–3L +1.5U 6.5
10/8/26@ STLW 3–2W +1.5U 5.5
10/5/26@ DALL 0–5L +1.5U 6.5

W win · L loss · T tie · P push · O over · U under · — unavailable.

Team comparison

Projected team stats

Parenthetical values show each team’s average over the last 365 days.

Projected team statistics for Sabres and Sharks
Statistic
28.2 (28.1)Shots26.8 (26.3)
20.2 (20.4)Hits21.9 (22.3)
13.6 (13.8)Blocked Shots14.2 (14.6)
26.9 (26.5)Faceoffs Won26.8 (26.9)
3.2 (3.1)Power Play Opportunities3.1 (3.1)
4.9 (4.8)Takeaways4.7 (4.6)
15.9 (15.7)Giveaways16.5 (16.5)
4.2 (4.0)Penalties3.8 (3.7)

Starting goalie context

Expected goalies

SabresColten EllisConfirmed
Player props1 market
Total Saves25.5Over-10551.2%Under-13056.5%
SharksYaroslav AskarovConfirmed
Player props1 market
Total Saves25.5Over-11553.5%Under-11553.5%
Lineup context

Projected lines

Buffalo Sabres
First line
  • CTage Thompson
    Player props3 markets
    Total Assists0.5Over+10548.8%Under-14058.3%
    Total Points0.5Over-22068.8%Under+16038.5%
    Total Shots on Goal3.5Over-10551.2%Under-12555.6%
  • LWZach Benson
    Player props3 markets
    Total Assists0.5Over+12544.4%Under-17063.0%
    Total Points0.5Over-14559.2%Under+10548.8%
    Total Shots on Goal2.5Over+13043.5%Under-18064.3%
  • RWKonsta Helenius
  • DRasmus Dahlin
    Player props3 markets
    Total Assists0.5Over-12555.6%Under-10551.2%
    Total Points0.5Over-20066.7%Under+14540.8%
    Total Shots on Goal2.5Over-12555.6%Under-11052.4%
  • DMattias Samuelsson
    Player props4 markets
    Total Assists0.5Over+26027.8%Under-36078.3%
    Total Blocked Shots1.5Over-12555.6%Under-11052.4%
    Total Points0.5Over+18035.7%Under-25071.4%
    Total Shots on Goal1.5Over+16537.7%Under-22569.2%
Second line
  • CNoah Ostlund
    Player props3 markets
    Total Assists0.5Over+17536.4%Under-23570.1%
    Total Points0.5Over-11052.4%Under-12555.6%
    Total Shots on Goal1.5Over-11052.4%Under-12054.5%
  • LWJosh Doan
    Player props3 markets
    Total Assists0.5Over+21531.7%Under-30075.0%
    Total Points0.5Over+10050.0%Under-13557.4%
    Total Shots on Goal1.5Over-12054.5%Under-11553.5%
  • RWJack Quinn
    Player props3 markets
    Total Assists0.5Over+12544.4%Under-16562.3%
    Total Points0.5Over-16562.3%Under+12045.5%
    Total Shots on Goal2.5Over-13056.5%Under-10551.2%
  • DOwen Power
    Player props3 markets
    Total Assists0.5Over+16537.7%Under-23069.7%
    Total Points0.5Over+12544.4%Under-17063.0%
    Total Shots on Goal1.5Over-10551.2%Under-13056.5%
  • DOlen Zellweger
    Player props3 markets
    Total Assists0.5Over+24529.0%Under-34077.3%
    Total Points0.5Over+17536.4%Under-24070.6%
    Total Shots on Goal1.5Over-14058.3%Under+10548.8%
San Jose Sharks
First line
  • CMacklin Celebrini
    Player props3 markets
    Total Assists0.5Over-15060.0%Under+11047.6%
    Total Points1.5Over+12045.5%Under-16061.5%
    Total Shots on Goal3.5Over-11052.4%Under-12555.6%
  • RWCollin Graf
    Player props3 markets
    Total Assists0.5Over+20532.8%Under-28073.7%
    Total Points0.5Over+12045.5%Under-16562.3%
    Total Shots on Goal1.5Over-10551.2%Under-13056.5%
  • DDarnell Nurse
    Player props4 markets
    Total Assists0.5Over+27027.0%Under-38079.2%
    Total Blocked Shots1.5Over-13056.5%Under-11052.4%
    Total Points0.5Over+20532.8%Under-28574.0%
    Total Shots on Goal1.5Over-12555.6%Under-11052.4%
  • DJacob Trouba
    Player props4 markets
    Total Assists0.5Over+20532.8%Under-28574.0%
    Total Blocked Shots1.5Over-17563.6%Under+12544.4%
    Total Points0.5Over+16537.7%Under-22068.8%
    Total Shots on Goal1.5Over-12555.6%Under-11052.4%
Second line
  • CMichael Misa
    Player props2 markets
    Total Assists0.5Over+20532.8%Under-28073.7%
    Total Points0.5Over+12045.5%Under-16562.3%
  • LWMason Marchment
    Player props3 markets
    Total Assists0.5Over+17037.0%Under-23570.1%
    Total Points0.5Over-10551.2%Under-13056.5%
    Total Shots on Goal1.5Over-15560.8%Under+11546.5%
  • DSam Dickinson
    Player props2 markets
    Total Assists0.5Over+55015.4%Under-90090.0%
    Total Points0.5Over+45018.2%Under-70087.5%
  • DMichael Kesselring
    Player props2 markets
    Total Assists0.5Over+42519.0%Under-65086.7%
    Total Points0.5Over+33023.3%Under-47582.6%


Get the complete matchup

Unlock every rated bet and the complete matchup intelligence with Premium.

Start 7-day free trial


Up next

More NHL matchups

Today · 9:00 PM
NJ8 – 4 – 0@COL6 – 5 – 1
Moneyline COL -148Total 6.5
NJJake AllenCOLMackenzie Blackwood
Sharp sideCOL -148
Sharp totalUnder 6.5
Explore NJ vs COL

Welcome back